Case Study / 2026
Confluence
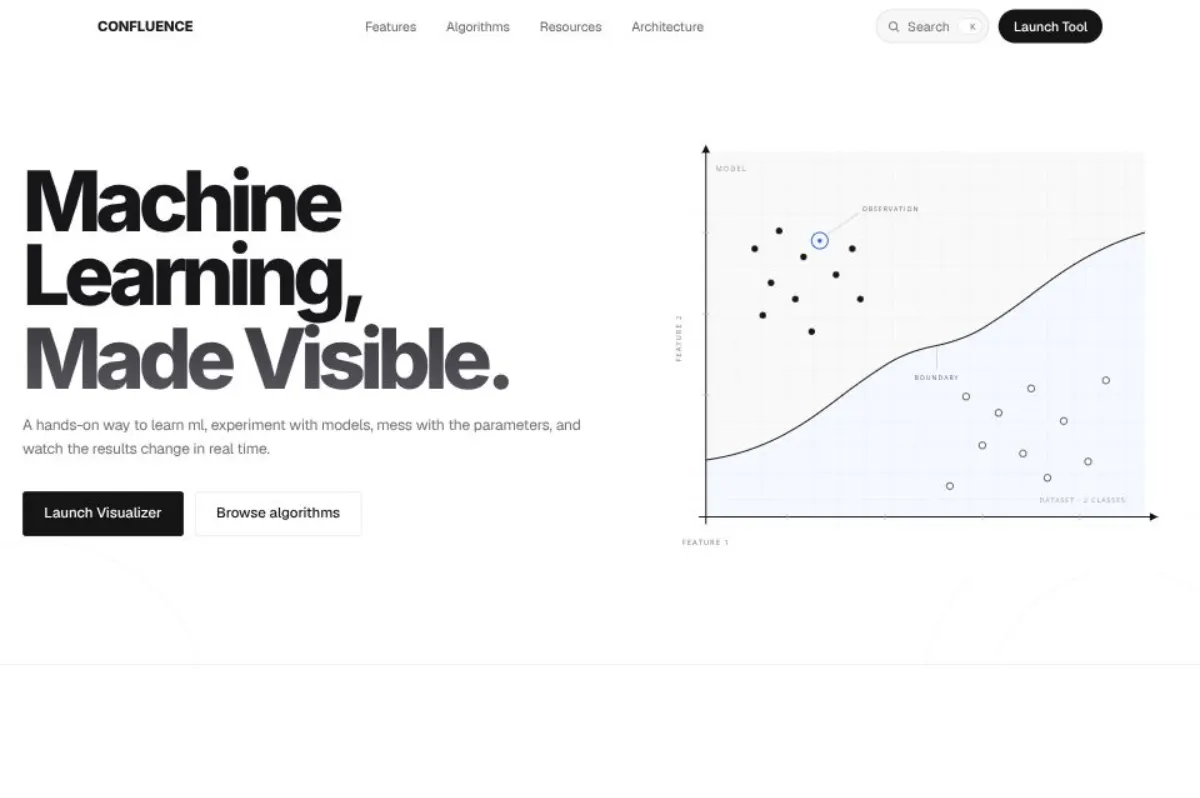
Confluence teaches ML by showing it. Thirty-eight real scikit-learn algorithms, decision boundaries you can poke at, training you can scrub through frame by frame, and 25 datasets from Iris to Titanic.

 Next.js 15


Project Features
What this case study includes
05 features
What Confluence is
Confluence is a browser playground for learning machine learning by watching it run. Pick an algorithm, pick a dataset, turn the knobs, and watch real scikit-learn compute the answer: decision-boundary heatmaps, loss curves, prediction explanations, and Python code you can copy out and run yourself.
38 algorithms across classification, regression, clustering, and dimensionality reduction. 25 datasets, a mix of Kaggle real-world data like Titanic and Heart Disease plus synthetic generators for when you want data with exactly one weird property.
Why I built it
I have never learned ML from a wall of math. It goes in one eye and out the other. The tools I tried fell into two camps: the fun ones did the math in the browser but stopped at three or four algorithms, and the serious ones had excellent math and zero buttons. I wanted the middle. Real compute, with handles on it.
How it works
The loop never changes: choose an algorithm, choose data, twist the knobs. The FastAPI backend runs real scikit-learn, and the Next.js frontend draws the result on Canvas2D: a decision-boundary heatmap with contour overlays, a 3D uncertainty surface showing where the model is guessing, and loss curves for whatever is training.
Training playback is frame streaming. The backend fits the model, steps through the epochs, and sends each step over a websocket as a frame carrying the boundary plus the current loss and weights. Play, pause, and scrubbing are just replaying those frames.
The stack is boring on purpose: Next.js and TypeScript up front, FastAPI in the middle, scikit-learn doing the math, Docker holding it together.
Technical decisions
- Real scikit-learn for every algorithm, never a browser reimplementation. The numbers on screen are sklearn's numbers.
- Every experiment exports the Python code that produced it, so nothing you learn is locked inside my website.
- Slider drags are debounced, so the backend only recomputes when you pause. You can also crank grid resolution from rough to fine yourself.
- Expensive grids get cached in Redis for an hour under a key made of the algorithm, the sorted hyperparameters, the dataset, and the resolution. The same setup twice means the second load is instant.
- Every algorithm card carries a boundary-shape tag (linear, tree-based, kernel, instance-based), which turned out to be a good way to shop for algorithms before running anything.
Limitations
- With no Redis running it computes every time, and a cold cache is something you feel.
- Cached grids expire after an hour, so the same setup recomputes later.
- The chat assistant answers from built-in notes unless you add an API key. With a key it uses a real model; without one it still works, just narrower.
- TODO(mahir): what actually breaks or annoys you today. Slow paths, half-finished views, datasets that misbehave. Replace this line with the real list.
What I learned
One scrubbable parameter teaches more than a shelf of static explanations. I could have shipped sixty algorithms; letting people drag gamma around did more work than all of them combined.
Showing uncertainty lands. The fog on the 3D surface is the most honest thing in the app, and people remember it longest.
Always give people the way out. The generated code means nothing you learn depends on my site staying up.
The full build story is in the build log article.
Links
- Live app: confluence.website
- Source code: github.com/mahirmlk/Confluence
- Build log: I made a visualization tool for ML algorithms